Click and filter (dashboards)
You can filter by clicking on a data element in a visualisation.
Advantages:
- This is very intuitive.
- In visualisations, you can filter by (practically) all data displayed. That means you can also set a filter on fields that are not listed as fixed filter fields.
To click and filter:
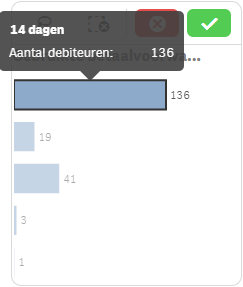
- In the visualisation, click on the filter value.
To use the legend to filter:
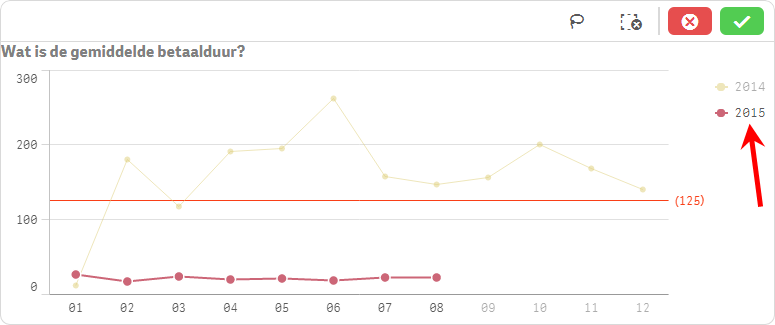
A graph shows values for several years, but you only want to see the values for a specific year.
- In the legend, click on the required value.