

Add a pivot table
From a worksheet with lines you add a new worksheet for the pivot table. For this purpose you use a special function from the Profit menu in Microsoft Excel, instead of the default function of Microsoft Excel.
You then lay out the pivot table by moving fields to the rows, columns and the calculation area of the pivot table. This is default functionality of Microsoft Excel. For more information, please refer to the online Help (F1) of Microsoft Excel.
In the following examples you add the following pivot table:

To add the pivot table:
- Go to: General / Output / Management / Analysis.
- Open the analysis or add an analysis.
- Go to the worksheet you want to use to create a pivot table.
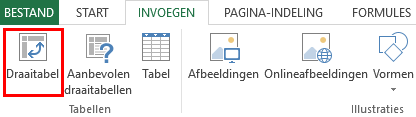
- Add a pivot table:
- Go to the 'Add-ins' menu.
- Go to: Profit / Add pivot table.
Profit shows a window with the description of the pivot table.
Only select the Extend bottom of data area with adjoining fixed data check box if you have manually added lines to the worksheet on which the pivot table is based.
- Click on: OK.
To lay out a pivot table:
- Drag the Profit fields to the appropriate area.
|
Directly to
|