Configure allocation breakdown
You can further break down the amounts allocated to axis 1. You must configure this extra component separately. The allocated amounts are further broken down from auxiliary allocation codes into main allocation codes. This uses a layered model to attribute costs and revenues to your end products (main cost centres) which provides you with optimal insight into the profitability of these products.
Note:
You can run the allocation for a specific period once. Therefore, we recommend that you make a backup after the configuration and test the actual distribution in this backup. To do so, complete the following steps:
- Configure your live environment according to the procedure described below.
- Make a backup of the live environment.
- Start the Financial / Allocation / Break down allocation function. You now break down the allocated costs.
- Check the final result using the provided views and reports.
If the final result is good, then break down the costs in your live environment. If not, first adjust the configuration in the live environment. After this, follow the above procedure again. Use this approach until you are certain that the configuration is good.
Description
Breaking down amounts often involves indirect costs. You cannot assign these costs to the correct allocation code in a single go during entry. Examples are energy costs, canteen costs, depreciations, salary costs, etc. A breakdown makes the actual costs visible, such as the actual costs by product.
Profit uses levels when breaking down costs, as shown in the example below. The costs are broken down in several steps, allowing you to use a different distribution by percentages for each subsequent step. Profit performs these steps in a fixed sequence based on the levels you have recorded. The levels are completed from low (1) to high (99). You must record the level distribution correctly or else the breakdown will be carried out in the wrong order. Thanks to the mandatory order, Profit also avoids circular references: in a circular reference, a higher level is referenced from a lower level, which causes amounts to be broken down again. Naturally, this is not desired.
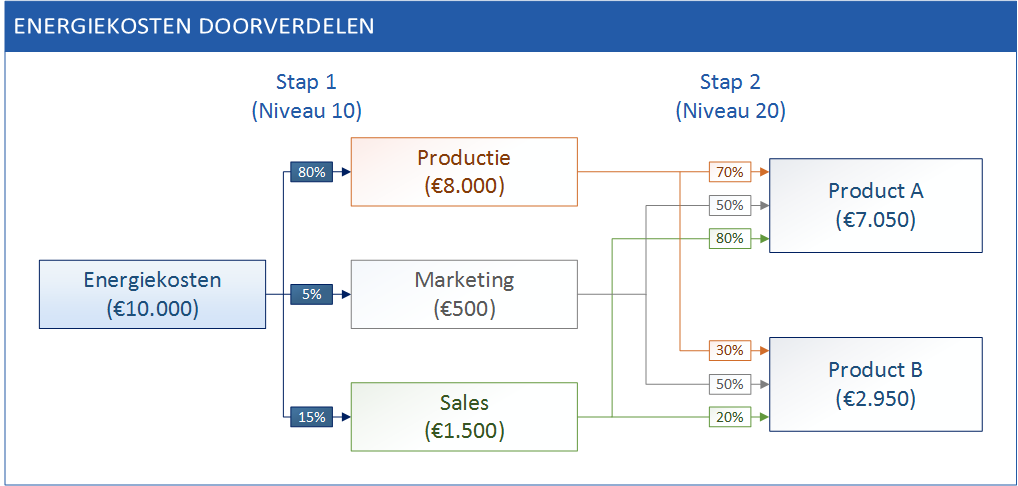
Business case 1: Break down energy costs
This example pertains to breaking down the Energiekosten cost centre. These costs must be covered by different departments and ultimately by the products.
You can enter the energy costs (invoices received) on different cost accounts, but you enter the Energiekosten cost centre for every entry. This allows you to collect all energy costs on this cost centre. You break the total energy costs down in two steps:
- Step 1: Energy costs by department
Here, you start with, for example, the number of square metres (for heating costs) and the consumption by devices (for electricity). Because the company in this example has a considerable production department, 80% of the energy costs are covered by that department.
(If you enter energy costs on several ledger accounts, you can indicate a separate distribution for each combination of ledger account/cost centre. This will not be taken into consideration any further here).
- Step 2: Energy costs by product
Here, you start from the expenditures made by the department for each product. For the Productie department, this is simple: out of the total production, 70% consists of units of product A and 30% of product B. The Marketing department spends the same amount of time on both products. For the Sales department, the focus is clearly on product A (80%).
You record the above configuration as follows:
- Cost centre Energiekosten
Record a distribution on level 10, into Productie, Marketing and Sales. Indicate that this distribution only applies to entries on the Energiekosten account.
- Cost centre Productie / Marketing / Sales
For Productie , you record a distribution at level 20 by Product A and Product B.
For Marketing , you record a distribution at level 20 by Product A and Product B.
For Sales , you record a distribution at level 20 by Product A and Product B.
The energy costs come to €10,000.00. During breakdown, level 10 is automatically completed first, followed by level 20. You will see that, for the first distribution, €8,000.00 ends up in Productie. This amount is then further subdivided into products A (€5,600) and B (€2,400). Breaking Marketing and Sales down into products results in the totals appearing in the image.
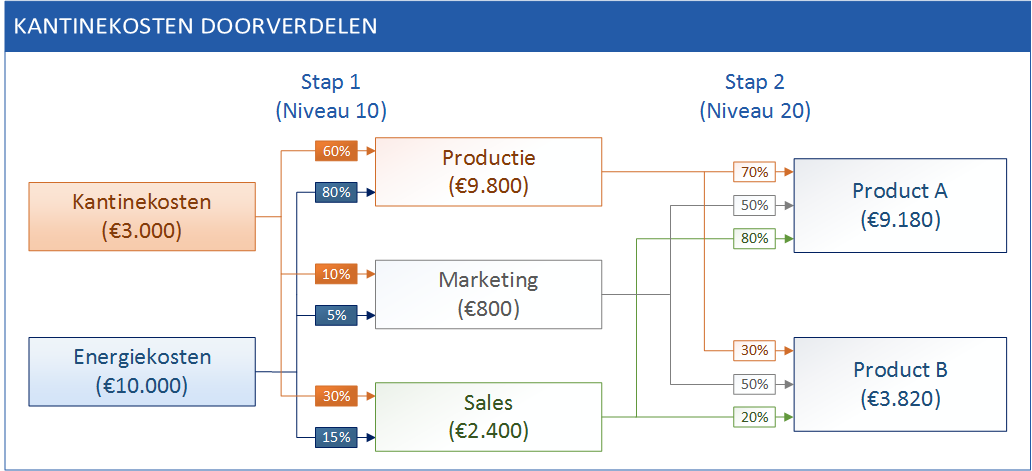
Business case 2: Break down canteen costs
This is a continuation of the preceding case. The canteen costs can be broken down based on the personnel occupancy across the Productie, Marketing and Sales departments. Once this has occurred, you continue with the above setup.
You break the canteen costs down in two steps:
- Step 1: canteen costs by department
Here, you start with the personnel occupancy of the departments.
- Step 2: Energy costs by product
For this, use the distribution added for business case 1.
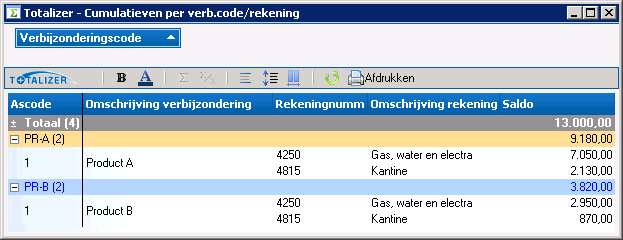
After breaking down the costs, you can retrieve an overview by selecting Financial / Allocation / Allocation per axis.
You can use the Totalizer to provide even more insight into the figures: