
Tables (Dashboards)
Tables show detailed information from Profit and are similar to the views in Profit and InSite. You can quickly find details.
Keep in mind, however, that the dashboards are always a little bit behind on the reality in Profit.
To use a table:
- Sort a table by clicking on a column header. A little triangle is shown under the header of the column the table is sorted on.
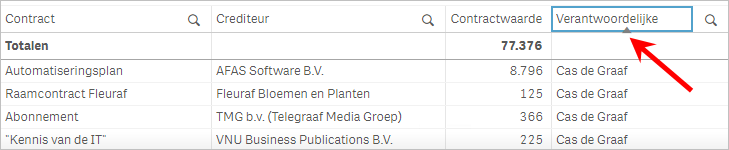
- You can apply a filter on columns that have a magnifying glass.
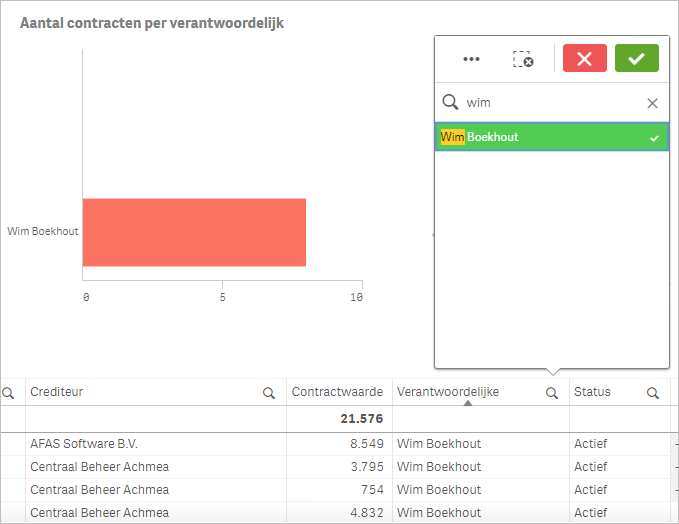
To search:
- Use the search function to quickly find something and to filter.
|
Directly to |