
Filter and zoom in (dashboards)
In some visualisations, you can filter and zoom in on data at the same time.
To filter and zoom in:
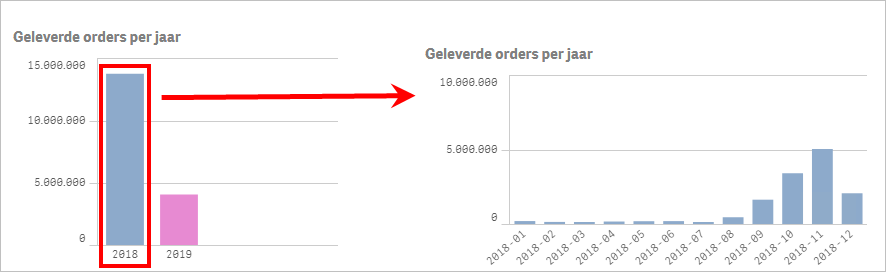
In this exercise, you click on a year in a visualisation. This filters the data by the year and at the same time the visualisation displays the months in that year.
- Open the dashboard: Debiteuren.
- Open the page: Betalingsgedrag.
- Click on: a filter value in a visualisation.
- Click on:
 .
.You filter by the filter value and at the same time zoom in on the data.
|
Directly to |