

Social cockpit
The social cockpit displays the absence figures within your organisation. Use this cockpit to keep you informed of deviating (absence) figures. It allows you to form a picture of the causes of the deviating figures and to take action in a timely fashion.
|
Contents |
View the social cockpit
You can view the social cockpit in InSite. In this cockpit, a 'drill down' function is available. That means that you can zoom in on the graphs displayed, so the details of a graph become visible. This will give you insight in the way the key indicators have been calculated. You have insight down to the level of the employee.
Note:
If you want to publish the social cockpit on InSite, you need to use the new method for it. If you have never published an analysis using this method, you must first perform a number of general preparations:
- New method for AFAS Online
- New method for a local installation
In this case, you do not change the 'PublishAnalysis' macro (for other analyses, this is required but not for the social analysis). You only record settings for the social analysis. This is explained below.
You can configure the social cockpit if you at least have installed Microsoft Office 2010 on your workstation.
To view the social cockpit:
- Go to: InSite.
- Go to: Social.
InSite may have been configured differently for you, in which case the description of the action deviates.
The cockpit consists of the following elements:
- Progressive
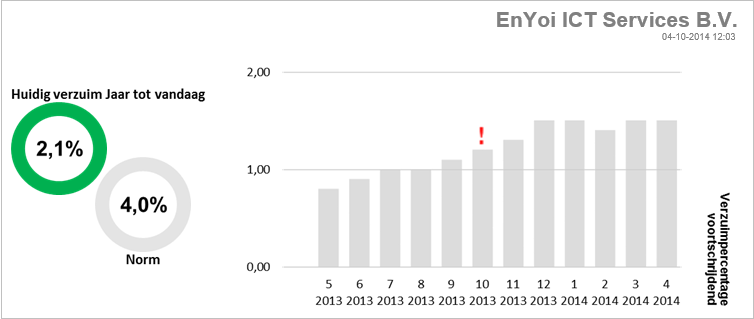
You see the progressive key indicators and the current numbers for the absence percentage, absence frequency and absence duration.
Progressive figures are always calculated over the previous year. An example can be found in the explanation of the calculation.
If the current number is higher than the norm, the number is displayed with a red outline.
If the percentage for an organisational unit is higher than the percentage for the organisation as a whole, an exclamation mark appears in the table.
- Per period
You see the key indicators and the current numbers per period for the absence percentage, absence frequency and absence duration.
If the current number is higher than the norm, the number is displayed with a red outline.
- Extra elements
You have insight into multiple social key indicators.
- Progressive
- Click on the description of the organisational unit.
An action button is available for every organisational unit for which the user is authorised. You can see organisational units at each level in the organisation chart.
Note:
The social analysis cannot be compared to the Office timetable absence analysis 2007 (Profit) analysis. This is because:
- By default, the social analysis looks back 12 months to find the progressive figures. You were free to determine the months for going back in the old absence analysis.
- The 'Absence in' method must be the same for both analyses. If, for example, you used a method that included a part-time % in the old absence analysis but not in the social analysis, you will also see other figures.
- Filters and all other settings must be the same in both analyses.
Record the social cockpit settings
For the social cockpit, you record settings at the analysis and the environment level.
To record the environment settings:
- Go to: HR / Management / Settings.
- Go to the tab: Social.
- Select the method in Absence in:
- Absence days (unweighted) and calendar days (unweighted)
If you use this method, the absence days are calculated as follows: Unweighted absence days / Unweighted calendar days
- Absence days (incl. pt % and presence %) and calendar days (incl. pt %)
If you use this method, the absence days are calculated as follows: (Unweighted absence days * PP% * 100-Pres.%) / (Unweighted calendar days * PP%)
- Absence days (incl. pt %) and calendar days (incl. pt %)
If you use this method, the absence days are calculated as follows: (Unweighted absence days * PP%) / (Unweighted calendar days * PP%)
- Absence days (incl. pt %) and calendar days (incl. pt %)
If you use this method, the absence days are calculated as follows: (Unweighted absence days * 100-Pres.%) / (Unweighted calendar days)
- Absence hours and timetable hours
If you use this method, the absence hours are calculated as follows: Absence hours / Timetable hours
- Absence days (unweighted) and calendar days (unweighted)
- Select the Show output per whole calendar year check box if you want to generate the cockpit for the current calendar year from January up to and including the current period.
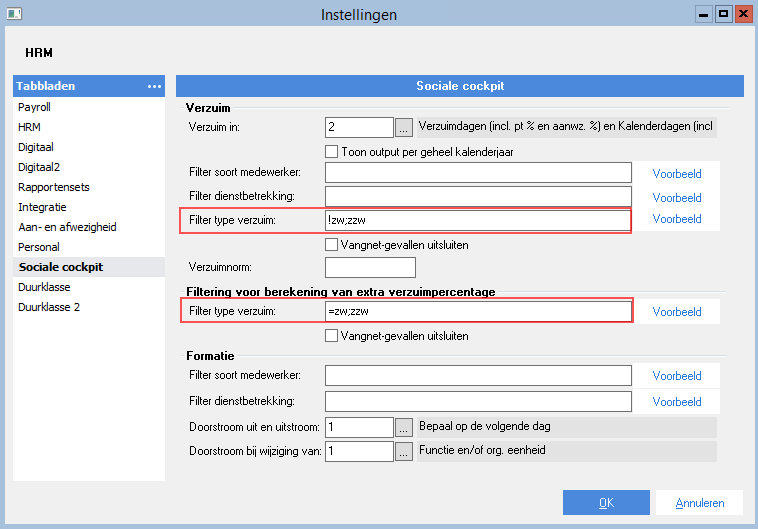
- Enter a filter by employee type, employment type or absence type to exclude data.
Example:
In accordance with the NVS standard, the absence percentage does not include absence due to pregnancy. However, you do want to map the pregnancy-related absence. In that case, you enter the absence type for pregnancy in the absence type filter.
- Enter a filter by employee type or employment type to exclude data from the position allocation.
- Select the throughput method.
- Go to the tab: Duration class.
- Enter the absence duration and age class.
- Go to the tab: Duration class 2.
- Enter the seniority class.
- Click on: OK.
To record the analysis settings:
- Go to: HR / Output / Management / HRM analysis.
- Select the Social analysis (Profit) analysis.
- Click on:Copy.
- Click on Next several times and then click on Finish to complete the wizard.
- Enter the start and end date.
The period between the start and end dates cannot be more than a year. The end date cannot be later then the current system date.
- Select the Hours per position check box to generate separate lines per employee and per position allocation. You can only do this if you have enabled the Employee authorisation based on position allocation activation. More information: Configure the organisation chart including the position allocation.
- Select the period table.
- Click on: Finish.
You open the analysis. Generating the analysis can take longer than normal because the calculations take place before Excel is opened.
- Go to: Invoegtoepassingen / Sociale cockpit / Instellingen.
- Select the sector of your organisation.
- Select the maximum layer for publishing in Maximale laag. By setting the maximum layer correctly, you prevent empty absence cockpits. If layer 9 is the last employee layer in the organisation chart, select layer 8.
By definition, employees in layer 9 are not authorised to view the social cockpit. They see the message 'Not authorised'.
- Enter the absence norm of the organisation in Verzuimnorm.
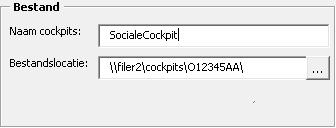
- Enter the name and file location for the cockpit.
The name is the name of the main page of the cockpit (it is however given an extra extension).
The file location is the folder where you publish the analysis. This is the main folder.
- For AFAS Online, you use this folder, for example:
\\filer2\cockpits\O12345AA\
Instead of 'O12345AA', you must use the name of the environment and must always close the location with a '\'.
- For a local installation, use the main folder that you set up yourself, supplemented with the name of the analysis.
- For AFAS Online, you use this folder, for example:
- In Te publiceren details cockpits, select the overviews you want to add to the social cockpit.
You can choose from all worksheets in the analysis whose description starts with Detail_. This means you have the option to add overviews yourself.
After publication, the selected overviews are available as a link under Direct naar in the cockpit.
- Click on: OK.
To publish the social cockpit on InSite:
You always publish the analysis using the new method. Make sure that you are familiar with this process and that you have performed all one-off preparations.
- New method for AFAS Online
- New method for a local installation
Note:
You do not need to change the 'PublishAnalysis' macro for this analysis. For other analyses, this is necessary because you have to include the publication folder in the 'PublishAnalysis' macro.
For the social analysis, you have already recorded the publication folder in the Bestandslocatie field in the analysis settings. The analysis automatically adds this folder if it is not yet present.
Key indicator calculation and remarks
In the calculation of the key indicators in the social cockpit, several conditions are taken into account. We use the NVS standard for absence registration: National absence statistics and we use the 'Vernet’ standard for the calculation of the progressive key indicators.
The calculation of the progressive figures over the past 12 months concerns the 12 periods preceding the reporting period.
Example: progressive:
In this example May is the current period and the charts report on data from period 6 of last year through period 5 of this year. So, 12 months.
To calculate the progressive figures for period 6 of last year, Profit looks back 12 months, so from period 6 of last year:
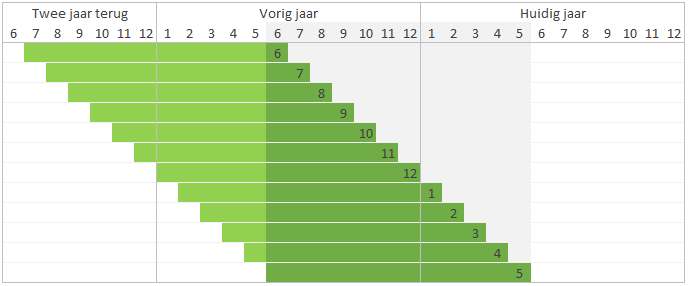
The periods ranging from 6 of last year up to and including 5 of the current year are the periods that you see on the cockpit.
The various calculations are as follows:
- Progressive absence percentage
Depending on the method selected in Absence in in the HR settings, the calculation is:
- Progressive number of days / progressive calendar days * 100
- Progressive number of hours / progressive number of timetable hours * 100
You see the moving absence percentage as from 1 January of the current year up to and including today's date in the Huidig verzuim Jaar tot vandaag circle. The chart shows the progressive absence percentages from today's date to a year ago.
- Absence percentage per period
Depending on the method selected in Absence in in the HR settings, the calculation is:
- Number of days per period / calendar days per period * 100
- Number of hours per period / timetable hours per period * 100
- Progressive absence frequency
Progressive absence entries / progressive weighted headcount per employment
The calculation of the weighted headcount is as follows: position allocation percentage / FTE percentage
An absence entry is not included if the Exclude absence entry from frequency statistics check box is selected in the properties of the absence entry.
- Absence frequency per period
(Absence entries per period * period factor) / (headcount for absence * period factor)
The period factor is: (number of days in year / number of days in period) / number of periods
Because of the period factor, the values of the periods are equal.
An absence entry is not included if the Exclude absence entry from frequency statistics check box is selected in the properties of the absence entry.
- Progressive average absence duration
Progressive sickness days at recovery / progressive number of recovery entries
- Average absence duration per period
Sickness days at recovery per period / number of recovery entries per period
- Absence percentage by duration classes
The classification into duration classes per period depends on the class configuration selected in the HR settings.
The formula is: Divide the total number of absence days of the absence duration class by the total number of calendar days of the entire population.
- Absence percentage due to pregnancy
The pregnancy-related absence percentage depends on the additional absence configuration selected in the HR settings.
- Headcount per employment
The headcount number at the end of the period. If an employee has multiple position lines within an organisational unit, the employee only counts once.
- FTE per employment
(( part-time percentage / 100) * position allocation percentage) * (calendar days of the position line / calendar days in the period).
- Inflow and outflow based on headcount
(( part-time percentage / 100) * position allocation percentage)
The chart showing the inflow/outflow uses absolute numbers to indicate how many FTEs were added and how many FTEs were deducted in a period.
- Turnover % based on FTE
(FTE outflow / sum of FTE on period end date) * 100
The chart showing the turnover uses percentages to show how much turnover (outflow) has occurred based on FTEs.
Assign rights to all layers in the Social Cockpit
If an employee needs to see the data for all organisational units in the social cockpit, you can configure this in two ways.
- Deviating authorisation in the analysis.
Enter the employee with the related OU and layer in the analysis. This means the employee is only authorised for the cockpit from the entered OU.
- Enter the position allocation of the employee.
Add a new line with the OU in the position allocation. The employee is authorised from the selected OU. This change also affects the authorisation of workflows.
Deviating authorisation in the analysis:
- Go to:HR / Output / Management / HRM analysis.
- Open the analysis.
- Go to the tab:Afwijkende_autorisatie.
Add the employees with the OU and related layer on this tab. The authentication XML includes these employees.
- Enter the employee code in Medewerker.
- Enter the OU and the corresponding layer for the deviating authorisation.
The employee is now authorised from the OU in question.
- Publish the analysis.
To change the position allocation:
- Go to: HR / Employee / Employee.
- Open the properties of the employee.
- Go to the tab: Job.
- Open the properties of the job.
- Go to the tab: Position allocation.
- Click on: New.
- Select the highest level in Organisational unit.
The employee can view the data for the selected organisational unit and its child units. You have activated theEmployee authorisation based on position allocation functionality.
- Change the other data.
- Enter 0.00 in Percentage.
- Enter a feature.
- Click on: Finish.
You now add a data filter in the authorisation. In the data filter, you filter on the value which is not the same as the entered feature value. You add this to the HR employees data filter. This filter works in combination with other data filters.
After you have added a data filter, you publish the analysis again.